Loading
< Back to Lessons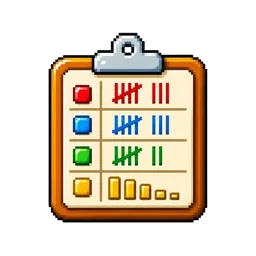
TALLY CHARTS
Collect data using tally marks and organize it into simple frequency tables.
L2L3
Section 1 / 2
LEADER TIP
Tally in groups of five (gate method). Let students collect real classroom data - shoe sizes, birth months, favourite colours.
BEFORE THIS LESSON, TRY
PRACTICE WITH THESE GAMES
Want more practice? Generate printable worksheets with similar problems.
Go to WorksheetsCONTINUE WITH: